Copyright © Had2Know 2010-2026. All Rights Reserved.
Terms of Use | Privacy Policy | Contact
Site Design by E. Emerson
Quadratic Regression Calculator
What is Quadratic Regression?
Quadratic regression is a form of multiple linear regression since the equationy = ax² + bx + c
is linear in the variables a, b, and, c, which are the undetermined coefficients of the quadratic equation in x. Since a, b, and c are bound in a linear relationship, you can use the least squares method to find the "best" values of a, b, and c.
In least squares regression, the aim is to find the values of a, b, and c that minimize the squared vertical distances between each data point (xi, yi) and the quadratic curve. In mathematical notation, you minimize the function
F(a, b, c) = ∑(yi - axi² - bxi - c)²
by solving the system of equations ∂F/∂a = 0, ∂F/∂b = 0, and ∂F/∂c = 0. This can be done with matrices.
How to Find the Best Fit Second Degree Polynomial: y = ax² + bx + c
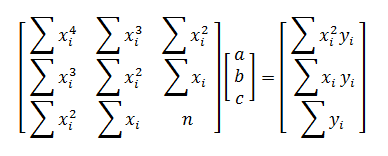
The matrix equation for quadratic regression is
where n is the number of data points (xi, yi). If the 3-by-3 matrix on the left is invertible, then there is a unique set of values for a, b, and c that minimizes the function F(a, b, c).
Finding the Correlation Coefficient r
The coefficient of correlation r measures how well the quadratic equation fits the data. When the coefficient is close to 1, it indicates good fit. Lower values of r indicate poorer fit. If r is low, you should check your data to see whether a quadratic equation is the most appropriate model for the points.For quadratic regression on a large number of points, the formula for r is
r = √ 1 - SSE/SST
where
SSE = ∑(yi - axi² - bxi - c)², and
SST = ∑(yi - y)²
When the sample is small, the value of r may not indicate the true level of fit. For instance, if you perform quadratic regression on three points, you will find the equation of the parabola that passed through the three points exactly. By definition of r, this will have a correlation of 1.
Example
A museum administrator assumes that the gross daily revenue from admissions is a quadratic function of the ticket price. The admin collects the following data in which X is the price of tickets and Y is the gross admissions revenues:(5, 1000) (5, 1100) (5.5, 1111)
(6, 1200) (6.5, 1352) (6.5, 1261)
(7, 1260) (7, 1400) (7, 1414)
(8, 1520) (8.5, 1360) (8.5, 1292)
(9, 1107) (9, 1008) (9.5, 950)
(9.5, 988) (10, 1000) (10, 910)
Using the quadratic regression calculator above, the best fit second-degree polynomial is
y = -65.5037x² + 954.6577x - 2114.4595
The maximum of this parabola is at x = 7.2871, which suggests that the optimal ticket price is around $7.28.
© Had2Know 2010
