
Copyright © Had2Know 2010-2026. All Rights Reserved.
Terms of Use | Privacy Policy | Contact
Site Design by E. Emerson
How to Graph Functions with Excel
Most math students and scientists use either a graphing calculator or mathematical modeling program to plot graphs of functions. The most popular tools for this purpose are the TI-83/84 calculators and the software program Mathematica.
However, in some cases it may be more convenient to graph equations of the form y = f(x) using MS Excel. For example, if you need to print the graph and you don't have Mathematica installed, it is easier to use Excel than to connect the graphing calculator to your computer. Some graphing calculators don't even have ports for connecting to computers. Furthermore, Excel is a very common application, so sharing files with others is a breeze.
(Step 1) Begin by opening up a new Excel workbook and entering "x" in cell A1 and "f(x)" in cell B1. These will serve as labels for the independent and dependent variables.
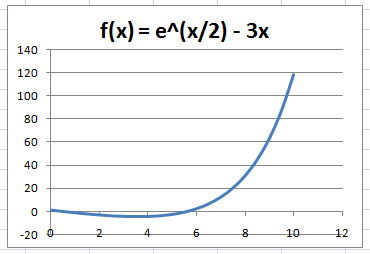
(Step 2) Next, determine the domain of the function's graph, that is, the range of x values over which you will plot the function. Enter the left endpoint of the domain in cell A2. For example, if you are graphing the function f(x) = ex/2 - 3x over the interval [0,10], you would enter 0 in cell A2.
(Step 3) Now determine the increment size for the x values. It is important to choose an increment size that is small enough to capture the important features of the graph. Excel does not actually plot the true curve of a function, but rather interpolates curves between adjacent points. If your step size is too coarse, the graph's shape will be inaccurate.
For instance, if you are plotting f(x) = sin(x) from 0 to pi, you should divide the interval into at least 10 pieces, that is, use an increment size of pi/10. For the function f(x) = ex/2 - 3x, we can use an increment size of 0.5.
(Step 4) Fill in the rest of x values in Column A using the appropriate increment size. For our example, we would fill Column A with 0, 0.5, 1, 1.5, ...9.5, 10.
There is a shortcut alternative to typing all of these x values by hand. Simply enter 0, 0.5, and 1 and then highlight the three cells. Click on the tiny square in the lower right-hand corner of the highlight box, and drag it down the length of Column A, stopping when you hit cell A22. Excel's Autofill feature will supply the rest of the values.
(Step 5) Now highlight Column A and go to the Formulas tab. Look for the section called either "Define Name" or "Name Manager" (depending on your version of Excel). Click it, and enter "x" as the name in the dialog box. (The name "x" may already be filled in for you.)
(Step 6) In cell B2, enter the function using Excel's syntax for math formulas. For the function f(x) = ex/2 - 3x, enter "=EXP(x/2)-x*3" without the quotation marks. If you click on another cell, the value of f(0) will appear in cell B2.
(Step 7) To apply this function to the rest of Column B, first highlight cell B2. Click on the tiny square in the lower right-hand corner of the highlight box, and drag it down the length of Column B, ending at cell B22. Watch as Excel magically populates Column B with the values of the function.
(Step 8) Almost done! To make a graph with the x and f(x) data pairs, highlight all of the cells, click "Insert," choose the Scatter plot group, and then choose the graph style with curves. Excel will generate a nice graph of f(x) over the specified domain. You can use the Layout and Design tools to tweak the labels and style of the graphic.
© Had2Know 2010