Copyright © Had2Know 2010-2026. All Rights Reserved.
Terms of Use | Privacy Policy | Contact
Site Design by E. Emerson
How to Use the Soil Texture Triangle
Soil texture depends on its composition and the relative portions of clay, sand, and silt. In sedimentology, clay is defined as particles of earth between 1µm and 3.9µm in diameter. (Not to be confused with the chemical definition of clay, which is a mixture of hydrous aluminium phyllosilicate particles and water.) Silt is defined as particles between 3.9µm and 62.5µm in diameter, while sand is particles between 62.5µm and 2mm; in diameter.
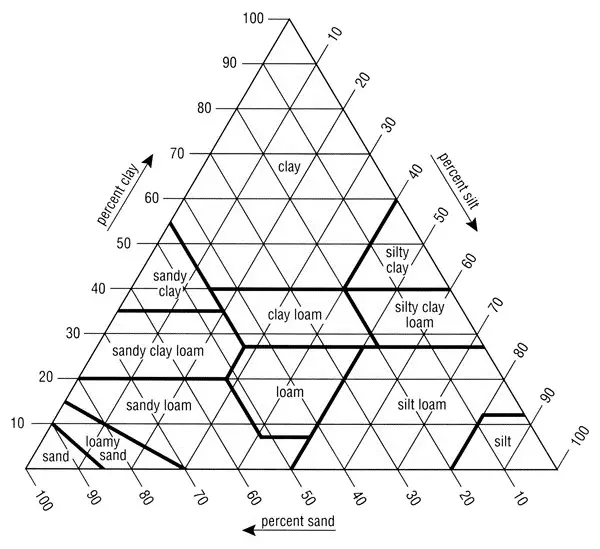
The USDA classifies soil types according to a soil texture triangle chart which gives names to various combinations of clay, sand, and silt. The chart can be a little confusing at first glance, however, it makes sense after seeing a few examples.

To classify a soil sample, you find the intersection of the three lines that correspond the three proportions. On the chart, all of the percents will add up to 100%.
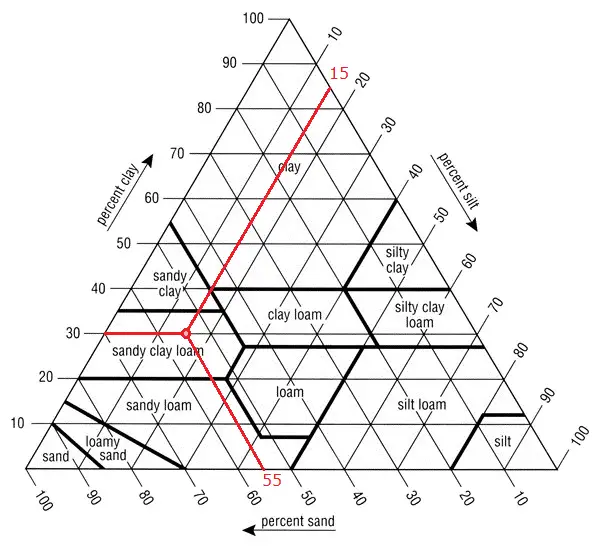
Example: Classify a soil sample that is 30% clay, 15% silt, and 55% sand. First, locate 30% on the clay axis, and draw a line horizontally from left to right. Next, locate 15% on the silt axis, and draw a line going down diagonally to the left. Finally, locate 55% on the sand axis, and draw a line going up diagonally to the left. The intersection is in a region called Sandy Clay Loam. See figure below. (Truthfully, you only need to make two lines.)

(1) 60% clay, 20% silt, 20% sand Clay
(2) 15% clay, 40% silt, 45% sand Loam
(3) 30% clay, 60% silt, 10% sand Silty Clay Loam
© Had2Know 2010
