
Copyright © Had2Know 2010-2026. All Rights Reserved.
Terms of Use | Privacy Policy | Contact
Site Design by E. Emerson
Gini Coefficient Calculator
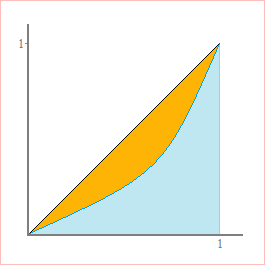
The Lorenz curve is the cumulative distribution function of wealth when individual's financial holdings are ordered from least to greatest. Each (x, y) point on the curve means that the bottom x% of the population owns y% of the wealth.
The Gini coefficient, named after Italian statistician Corrado Gini, is a dimensionless measure of statistical dispersion that is frequently used in the analysis of income distribution.
The Gini coefficient, G, of a data set or income distribution curve ranges from 0 to 1, with 1 being the most unequal distribution of wealth (one person owns everything) and 0 being the most equal (each person owns an equal share).
Mathematically, G is the ratio of the area between the wealth distribution curve (Lorenz curve) and the line of equal distribution (straight line) to the area under the equal distribution curve. This is best described graphically:
Computing the Gini Coefficient (Empirical Distribution)
For an empirical Lorenz curve, one generated by discrete data points, you can compute the Gini coefficient with the formula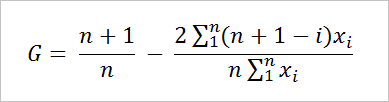
the bottom 20% own $2, or 16.7% of the wealth
the bottom 40% own $4, or 33.3% of the wealth
the bottom 60% own $6, or 50% of the wealth
the bottom 80% own $9, or 75% of the wealth
the bottom 100% own $12, or 100% of the wealth
The Lorenz curve is
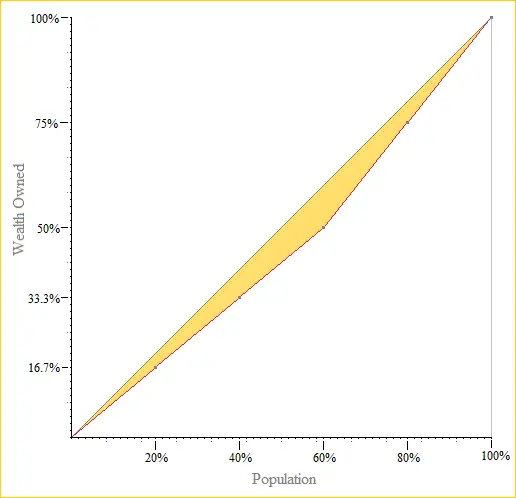
6/5 - (2*33)/(5*12) = 1.2 -1.1 = 0.1
Computing the Gini Coefficient (Theoretic Distribution)
If the Lorenz curve is given by a function f(x) over the interval [0, 1], then the Gini coefficient can be found with integration. The formula is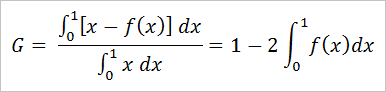
© Had2Know 2010