What Is a Lorenz Curve?
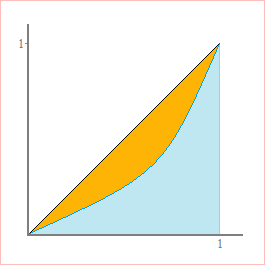
A Lorenz curve is an econometric tool that models the distribution of wealth, income, or other resources. If the members of a population are ordered from least wealth to greatest wealth, then each point (x, y) on the Lorenz curve signifies that the bottom x% of the population holds y% of the total wealth.
In a population where everyone's wealth is equal, the bottom x% own exactly x% of the total. The resulting Lorenz curve for this scenario is a straight line, known as the line of total equality. When the distribution or resources is unequal, y is less than x. The area of the gap between the line of total equality and the Lorenz curve is the basis for the Gini coefficient of inequality.

A Lorenz curve f(x) is defined on the interval [0, 1] and satisfies the following properties:
- f(x) is continuous on [0, 1]
- f(0) = 0 and f(1) = 1
(The bottom 0% own 0% of the wealth, and the bottom 100% own 100% of the wealth.) - f(x) is increasing on [0, 1]
- f'(x) is non-decreasing on [0, 1]
(A Lorenz curve cannot be concave down on a subinterval of [0, 1], however, it can be linear in places. For example, the Lorenz curve derived from discrete data is a piecewise linear function.)
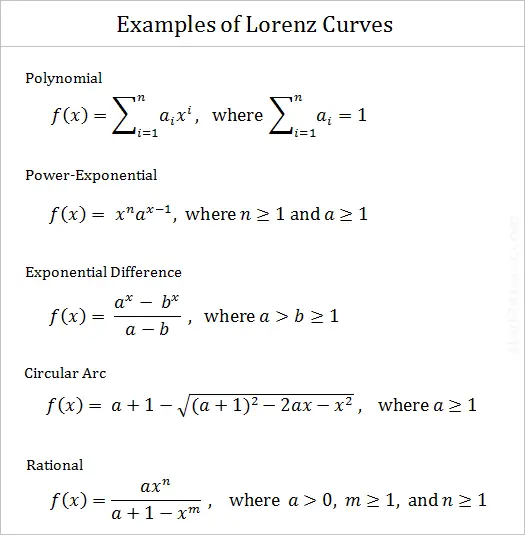
Here are some examples of Lorenz curve equations:

Several Lorenz curves can have the same Gini coefficient, for example, L₁(x) = x² and L₂(x) = (x + 2x³)/3 both have a Gini coefficient of 1/3.
The weighted average of two or more Lorenz curves is also a Lorenz curve, so long as the weights add up to 1. The corresponding Gini coefficient is the weighted average of the individual Gini coefficients. The product of two Lorenz curves is also a Lorenz curve; the resulting Gini coefficient is strictly greater than the factor curves' Gini coefficients.
© Had2Know 2010
