Copyright © Had2Know 2010-2026. All Rights Reserved.
Terms of Use | Privacy Policy | Contact
Site Design by E. Emerson
How to Compute Normal Distribution Probabilities
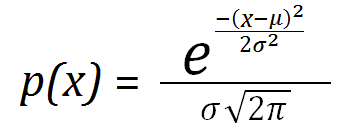
In statistics and probability theory, the Normal Distribution (aka Gaussian Distribution or bell curve) is a symmetric probability density function defined by the function

where μ is the mean, σ2 is the variance, and σ is the standard deviation.
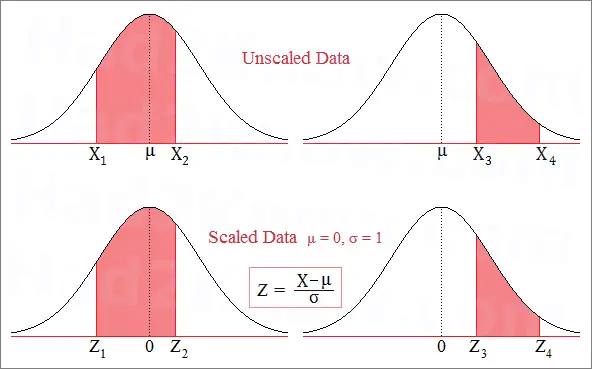
When μ = 0 and σ = 1, the curve is the standard normal distribution. You can standardize (rescale) any normal distribution by making the substitution Z = (X-μ)/σ. In other words, you subtract the mean from each raw data point and divide by the standard deviation. The Z values are often called Z-scores. Calculating Z-scores allows you to figure probabilities using a normal curve table or the calculator on the left.
Properties of the Normal Curve
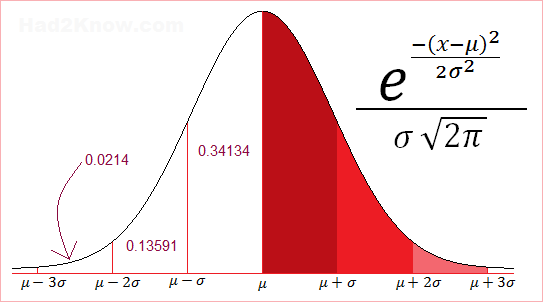
When data is distributed normally, one can observe several nice features. The most obvious is that the mean and the median of the data are equal, that is, the distribution is symmetric about the mean.Most of the data is close to the average; fewer observations are found the further you deviate from the average. About 68.27% of the data falls within ±1 standard deviation from the mean. About 95.45% of the data falls within ±2 standard deviations from the mean, and over 99% falls with in ±3 standard deviations from the mean.

How to Compute Z-Scores and Use Them to Calculate Probability
Suppose you have normally distributed data with a mean of 5.1 and a standard deviation of 2.8. If you want to find the probability that an observed data point X is between 3 and 11.2, then you need to standardize the data first. In other words, you need to find A and B such thatP(3 < X < 11.2) = P(A < Z < B),
where Z is a data point in the standard normal curve. Once you know A and B, you can look up the values of N(A) and N(B) from a normal distribution table. Then you compute the probability with the formula
P(A < Z < B) = N(B) - N(A).
Using the transformation equation Z = (X-μ)/σ gives you A and B: A = (3-5.1)/2.8 = -0.75 and B = (11.2-5.1)/2.8 ≈ 2.18. Using a Z-score table, you find that N(-0.75) = 0.22663 and N(2.18) = 0.98537. Thus, the probability is 0.98537 - 0.22663 = 0.75874.
This means there is a 75.8% chance that a data point will fall between 3 and 11.2. You can also use the calculator above to compute the probability of data falling within a given range. You may enter raw data values along with the mean and standard deviation, or enter the data Z-scores.

© Had2Know 2010
