How to Read a Z-Score Table to Compute Probability
In statistics, the Gaussian or Normal Distribution is one of the most frequently encountered probability density functions. Many variable traits in nature are distributed normally, for instance, human height, shoe size, and scores on certain kinds of intelligence tests.
Z-score tables are based on a normal distribution that has a mean of 0 and a standard deviation of 1. If you have a set of normally distributed data with a different mean and standard distribution, you can transform it into standard form with the scaling equation (X-μ)/σ = Z. Here X is the unscaled data value, μ is the population mean, σ is the population standard deviation, and Z is the corresponding scaled value.
Once you have a set of scaled or standardized data, you can use a Z-Score table or normal distribution probability calculator to compute the probability that the random variable Z is between two values.
How to Read a Z-Score Table
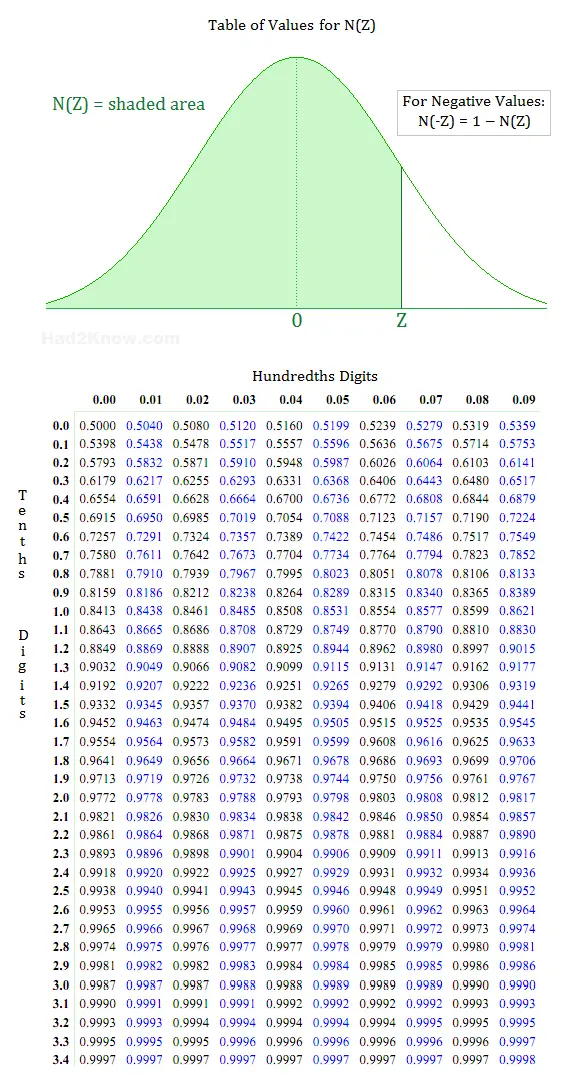
For the sake of example, suppose Z is a normally distributed random variable and you want to compute P(0.46 < Z < 2.09). First you find the values of N(2.09) and N(0.46) from the table, then you subtract the two values to obtain the probability.Each row of the Z-score table shows the Z-scores up to the tenths digit. Each column further refines the Z-score to the hundredths digit. For instance, to find the N(Z) value for Z = 0.46, first locate the row of 0.4. Then, locate the 0.06 column. Where the row and column intersect is the value for 0.46. From the table below, you can see that N(0.46) = 0.6772. Likewise, N(2.09) = 0.9817.

N(-Z) = 1 - N(Z)
For example, to compute P(-0.7 < Z < 0.8), you find N(0.8) = 0.7881 and N(0.7) = 0.758. Thus, N(-0.7) = 1 - 0.758 = 0.242. Therefore,
P(-0.7 < Z < 0.8) = N(0.8) - N(-0.7) = 0.7881 - 0.242 = 0.5461
© Had2Know 2010
