
Copyright © Had2Know 2010-2026. All Rights Reserved.
Terms of Use | Privacy Policy | Contact
Site Design by E. Emerson
How to Test Whether Data is Normally Distributed
Researchers who collect and analyze tons of numerical data usually run checks to see whether their data comes from normally distributed populations. Many statistical tests rely on the assumption that data is distributed according to a normal or Gaussian curve, and if the data is not normal these tools won't work.
Statisticians can use both simple and complex mathematical techniques to determine if a set of numbers is distributed normally. Some of these methods can be applied by hand, while others require more sophisticated software packages such as SPSS or Mathematica. Regardless of the methods used, the more data you have available, the better you can determine whether data is normal or not. If tests indicate that your numbers are likely normal, then you can use either a bell curve probability calculator or Z-score table to compute probabilities.
Graphical Analysis
An easy way to test for normality is to make a histogram of the data. If the shape of the distribution resembles a bell curve, the data is likely normal.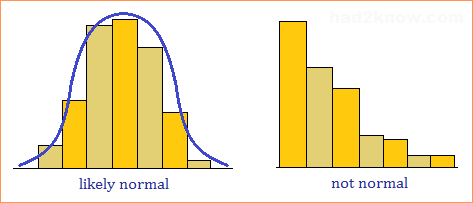
Mean and Variance Tests
In a normal distribution, the mean is equal to the median. Also, about 68% of the data is within one standard deviation of the mean, 95% is within two standard deviations, and 99% is within three standard deviations. If your data set also has these properties, then your numbers may come from a population that is normally distributed.This is sometimes called the "back of the envelope test" because it's easy to carry out by hand or with a hand calculator. First you must compute the sample mean, sample median, and sample standard deviation. (Use the Stats Calculator.) Then check your data to see if it displays properties of the normal distribution.
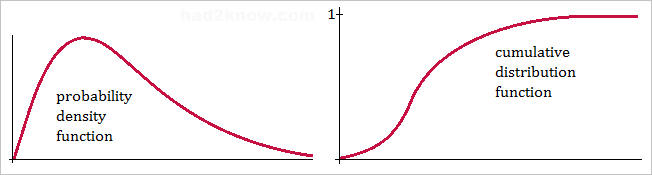
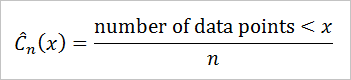
Empirical Cumulative Distribution Function
If p(x) is a probability density function, then the cumulative distribution function C(x) is given by the equation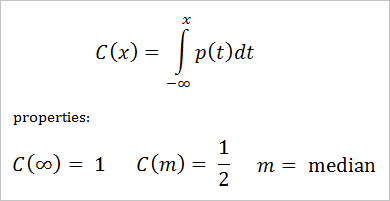

Log Normality
Often the raw data itself is not normally distributed, but the logarithm of the data may in fact be a normally distributed set. To test if your numbers are log-normal, take the logarithm of each point, then apply one or all of the tests above.© Had2Know 2010